My Predictions On The U.S. Economy Following A Global Pandemic
- Elisa Marconell
- Jun 23, 2021
- 11 min read

"I believe the US economy, once it has regained the real GDP level of $19.253trn, will grow more rapidly in the next three years than 2.25% on average"
CONTEXT:
Before expanding into the narrative regarding my position on the United States GDP potential, it is at the utmost importance to fully grasp where the idea of GDP derives from and what the key factors to increase or decrease it are. By definition, the Gross Domestic Product entails a “monetary measure of the market value of all the final goods and services produced in a specific time period” (Oxford Dictionary, 2019).
There are three key aspects that define the GDP: money, final goods, and specific period. In the case of the Gross Domestic Product, the rationing device is money, as it would be difficult to measure the national income in terms of pigs, sandwiches, or Rolex watches. When Kuznets presented the original formulation of the GDP, his idea was to capture all economic production costs by the government, individuals, and companies in a single measure to make calculations simple.
Another key element of the GDP is that it only measures the cost of final goods. If we were to measure both final and intermediate goods, the GDP calculations would exponentially increase thus it is best to measure it in terms of final goods only.
Finally, the GDP soley accounts for goods and services produced in a certain time frame. By having it set over a specific amount of time, nations can utilize the GDP as a benchmark to see how they are doing comparatively to other states and other time periods. However, this means that those products bought and sold that were not produced within that specific time period will not be counted toward the GDP. For instance, if I were to purchase a bed frame that was built in 2019 it would not be able to count for the 2021 annual GDP. Similarly, if I were to purchase honey created 10 months ago, although it has been less than a year and would count for the annual GDP, it would not not for the Quarterly GDP.
Finally, the GDP is not solely measured by consumer expenditure. But by the sum of Firm Investment (I), Government Expenditure (G), Consumer Spending (C) and Net Exports (NX). Through the equation GDP = C + I + G + NX one can find mathematical relationships between GDP increase or decrease.
As we familiarize with the basics of GDP, one may wonder how one’s country could increase or decrease theirs. This all circles back to the idea of the circular flow of income. Essentially, the circular flow of income is a model of the economy in which the major exchanges are represented as flows of money, goods and services, etc. between economic agents. The flows of money and goods exchanged in a closed circuit correspond in value but run in the opposite direction.
Figure 01 - Simple Circular Flow

Within Figure 01, one envisions the circular flow of income in two separate markets: the resource market, and the consumer market. Within the Resource Market, the households become the suppliers of the factors of production (labor, land, capital) and the firms become the suppliers by offering goods and services. While in the Consumer Market, the households become the buyers for the goods and services and the firms the suppliers as they give wages, rent, and dividends to the workers.
This however, is a very deep simplification of the circular flow of income as it does not take the government and the global markets into account. The diagram below indicates a more accurate representation of the circular flow of income as the government, exports and imports appear. The circular flow has four key components: households, firms, the government and the external sector. Households purchase goods and services from businesses and gain income from their work in the resource market. Households are a key factor to understand in the flow, as consumer spending holds the most presence in the American GDP. Firms hire the factors of production such as labor and utilize them to produce output in the form of goods and services. Firms often pay for the wages of the households as they extend their labour to them. Governments collect taxes to fund collective spending on public goods. By receiving a percentage of money from the firms and households (and perhaps even trade) they can afford investing in the country though the funding of schools, infrastructure, social security and other public goods. Government injections are especially crucial when a crisis arises, as their occupation is to protect its citizens. There is also the world trade system of trade where countries can specialize and import or export their goods and services to other nations for money.
Figure 02 - Circular Flow Model
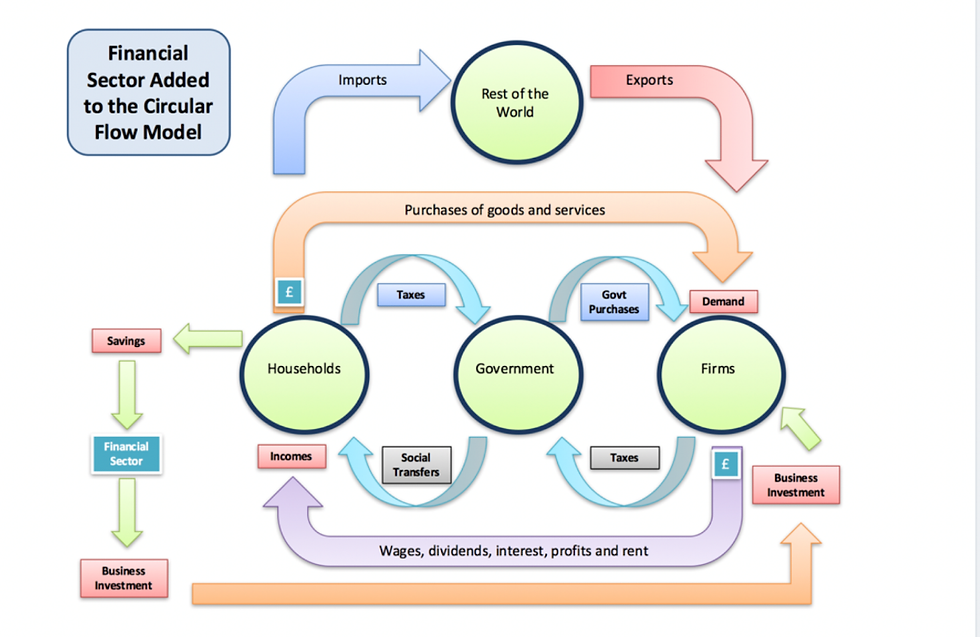
This figure shows there are three instances where the cash exits or enters the flow. In the case of entering the flow of income, Government Expenditure, Firm Investment and Exports are critical to increase the GDP. These are called injections as they often “puff up” the bubble when they exceed withdrawals. On the other hand, Net Taxation, Imports and Saving are considered withdrawals as they take money out of the system and decrease the GDP. When injections and withdrawals are in equilibrium, the GDP will remain in place. When I>W, the GDP will rise. When I<W the GDP will fall.
MY POSITION
Following the strong recovery the United States made from the past financial crisis of 2008 with an average growth of 2.3% per year, as well as the current government administration providing injections, I believe the United States will rapidly recover with an average growth of 2.25% per annum.
Figure 03- Real Gross Domestic Product (Quarterly. 2003-2020)

To begin with, one has to analyze data from similar historical events. Following the market crash of 2008, both the United States and global economies were put on hold as a result of defaults in consolidated Mortgage Backed Securities. Due to payments of mortgages not being paid on time (or defaulting), the Special Purpose Entities could not issue equity to even the senior investors. This caused the United States to nearly lose 8 trillion USD. However, unlike the Great Recession of 1929 that took 25 years to recover, the financial crisis of 2008 took 4 years to get back on track.
Why so? It was due to injections in the circular flow of income derived from government expenditure. In those 18 months of recovery, the United States government gave the firms a 700 billion USD bailout along with a government stimulus of 800 billion. This money was put in the United States circular flow of income and puffed up the bubble until injections exceed withdrawals and the economy was able to grow once again. As one can see in the Real GDP graph (Figure 03) assembled by the Federal Reserve Bank of St. Louis, in the second Quarter of 2009, the US GDP hit its highest low of 15.14 trillion in. However, following the injections by the government and the rise of consumer expenditure, the economy was able to grow once again by a common factor of 2.3 percent per annum until Q2 of 2020.
After analyzing the GDP growth and recovery of the 2008 market crash, we can utilize factors of the past to predict the present. In the second quarter of 2020, the Real Gross Domestic Product (GDP) decreased at a rate of 31.7 percent in Q2 due to the COVID-19 pandemic.
In 2020, the world was struck with a global pandemic. This pandemic became deadly, thus several governments across the world were forced to shut down their countries and their people. Individuals were worried, businesses were at risk, and tourism became non-existent. For instance, countries like Spain whose main contributor to their GDP was tourism especially took a toll. As a matter of fact, approximately 95.5% of Spain's GDP now represents its debt. Although much lighter, the U.S certainly took a toll as hopelessness grew among the American public and uncertainty entered their minds. What if I lost my job? What if the business goes bankrupt? What if I can't sustain my small business anymore? These questions propagated the American minds and prompted them to save money exponentially to provide for the uncertain future. As we know from the context section, savings is a withdrawal that shrinks the GDP over time. Thus, when Americans do not spend their disposable income and their marginal propensity to consume lowers while the marginal propensity to save heightens, the GDP decreases. Within the following chart from FRED (Figure 04- Personal Saving Rate), one can see how the consumer saving behavior lowered the GDP as it is often the most contributing factor of the equation. The personal savings of the American public grew to 33%, thus the GDP on Q2 took a toll of 2 trillion dollars (Pew Research Center, 2020).
Figure 04- Personal Saving Rate (Monthly. 5Y)

However, with news of the vaccine and President Biden’s COVID-19 plan, including injections of stimulus funding, everything began to settle. According to the CDCP, approximately 10% of the U.S population is vaccinated as of March 1st 2021. This statistic is of major importance to the economy due to the expectations it withholds it allows the American public to have hope for the future, reduce the anxiety for savings and limited expenditure. In economics, we see high expectations as a synonym for increased demand and increased economic growth. When a large amount of people speculate that the economy will perform well, they will begin to invest in the economy by withdrawing savings and increasing consumption. As the fear of the uncertainty washes away with the vaccine, citizens will now be prompted to consume more thus allowing the GDP to grow further.
Figure 05 - Personal Consumption Expenditures (Monthly. 15Y)

As we can witness from the FRED time series graph in Figure 05 - Personal Consumption Expenditures, the consumer spending has almost recovered to the original pre-pandemic value of 14,877 billion. As of January 2021, the personal consumption expenditure is 14,816. However, this data was collected when only 2% of the United States public was vaccinated. Based on the theory of market expectations, we can assume that the number recorded in March will be much higher as 10% of the population will be vaccinated. Subsequently, the number will only increase as we are approaching the maximum vaccination benchmark making a swift recovery from the original decrease of 31% back in Q2 2020.
Figure 06 - Government Total Expenditures (Quarterly. 5Y)

Figure 07 - Real Gross Domestic Product (Quarterly. 5Y)

With the past administration under President Trump the government drove its expenditures toward a 50.27 percent increase in Q2 at the attempt to inject money towards the GDP and avoid further repercussions (Figure 06 - Government Total Expenditures). This tactic had worked as the injections exceeded the withdrawals and the GDP was able to grow by a margin of 7.47 percent over Quarter 3 (Figure 07 - Real Gross Domestic Product). And in the fourth quarter, it managed to increase by an approximate 1.007 percent. With an overall increase of 8.477 between Quarter 3 and Quarter 4, one can assume that with the vaccine becoming more and more prominent in society the GDP will remain increasing. For instance, as more individuals receive the vaccine, the government will ease the lockdown thus more businesses could open once again prompting more job opportunities for the unemployed. As more people become employed, they will be more likely to spend once again and the MPC will heighten.
Figure 08 - E-Commerce Retail Sales as Percent of Total Sales (Quarterly. 5Y)

The pandemic has also allowed for the E-Commerce industry to flourish, as we have never been so dependent on technology. On average, the E-Commerce business model has grown an approximate 5.3 percent in Q2, 3% in Q3 and 2.7% in Q4 from last year's benchmark. The businesses that were able to adapt to technology by opening e-commerce stores, establishing a strong presence in social media and engaging with the customers were able to thrive. On the other hand, traditional brick-and-mortar retailers with weak online presence began to vanish, with several prominent firms such as J.C. Penney filing for bankruptcy. The current pandemic has heightened uncertainty, however it has vastly accelerated digital adoption. And according to the World Bank “Unique digital shoppers increased in most countries, with a few exceptions where lockdown policies restricted all types of economic activities, including E-Commerce” (Figure 08)
Finally, President Biden is attempting to increase government spending in several factors of the economy. Signed on February 1st 2021, the novel President reversed a bid created by President Trump to reduce 27.4 billion in government spending. President Biden will be also pushing for a 900 billion Covid-19 relief bill as well as a legislation including a $600 check for every adult citizen in the nation. President Biden is also an avid supporter of buying domestically, as on January 25th he signed a “Buy American” order for government procurement. According to Yuka Hayashi from the Wall Street Journal, “The new policies will include tightening the government procurement rules to make it harder for federal agencies to purchase imported products, revising the definition of American-made products and raising local-content requirements. The executive order also aims to ensure that small and midsize businesses will have better access to information needed to bid for government contracts.”, thus making leakages harder to occur (Hayashi, 2021). In addition, President Biden will be looking forward to better education with his administration. The President's proposed education policies include investing in early childhood instruction, safely reopening schools in a quick and effective manner, increasing wages for instructors, and finally eradicating the prevalent funding difference between the affluent and low-income districts.
In the long term, the investment on public education may benefit the economy. If the education support on President Biden’s end remains continuous and steady, the ceteris paribus on labor force will be violated as there will be more qualified applicants to enter the workforce. Within this change, entrepreneurship will potentially blossom as those with a strong foundation of academic basics are able to go on and create wonders such as higher technology and other capital. This chain reaction will be able to move the Production Possibilities Frontier of the United States of America away from the origin and to a greater amount of production. Due to a larger array of goods and services provided and sold, not only will the U.S economy rise but its trade possibilities will flourish. The United States could potentially earn a comparative advantage in several goods or services they can later choose to trade with. Within the following figure, a violation of the ceteris paribus is showcased. Following that, the curve shifts to the right and prospers in the economy.
Figure 09 - PPF

Prior to focusing on mass public education, the United States has a maximum output of points B and A (they are productively efficient), yet is realistically in point D as there are unused resources remaining. However, after the mass public education reform the United States will have a skilled labor force to propagate them to a greater output variety by shifting to the right. Now, the optimal yet unrealistic point becomes C. However, realistically the United States will stand closer to points B and A if it does not use up their resources.
Conclusion
The current pandemic has not only affected society and interaction, but has taken a toll on the American economy. As of the second quarter of 2020, the GDP had decreased by more than 30% due to job losses, low consumer expenditure and a spike in savings. These factors were mostly the product of uncertainty, as individuals and corporations had low expectations for the economy and began to prepare for the worst.
Luckily, the government has implemented measures to mitigate these impacts by providing stimulus packages to promote job creation and encouraging households to increase consumption locally as well as spending on public services such as education to improve the future labor and entrepreneurial force. These measures together with the vaccines are giving confidence to a society who has already begun to increase the efforts to expand the GDP thus we have already seen signs of recovery.
Additional measures and vaccination rates will continue increasing throughout the next years and as a result I expect that GDP will continue growing steadily over the next few years by an increment of 2.25 percent.
Works Cited
“Fact Sheet: President Biden's New Executive Actions Deliver Economic Relief for American Families and Businesses Amid the COVID-19 Crises.” The White House, The United States Government, 22 Jan. 2021, www.whitehouse.gov/briefing-room/statements-releases/2021/01/22/fact-sheet-president-bidens-new-executive-actions-deliver-economic-relief-for-american-families-and-businesses-amid-the-covid-19-crises/.
“Federal Reserve Economic Data: FRED: St. Louis Fed.” FRED, Federal Reserve Bank of St. Louis, fred.stlouisfed.org/.
Fregni, Jessica. “The Future of Education Under the Biden Administration.” Teach For America, 7 Jan. 2021, www.teachforamerica.org/stories/the-future-of-education-under-the-biden-administration.
Parker, Kim, et al. “Economic Fallout From COVID-19 Continues To Hit Lower-Income Americans the Hardest.” Pew Research Center's Social & Demographic Trends Project, Pew Research Center, 30 Oct. 2020, www.pewresearch.org/social-trends/2020/09/24/economic-fallout-from-covid-19-continues-to-hit-lower-income-americans-the-hardest/.
Singh, Manoj. “The 2007-2008 Financial Crisis in Review.” Investopedia, Investopedia, 28 Jan. 2021, www.investopedia.com/articles/economics/09/financial-crisis-review.asp.
Staff, Investopedia. “Circular Flow Model.” Investopedia, Investopedia, 9 Feb. 2021, www.investopedia.com/terms/circular-flow-of-income.asp.
“Understanding the Circular Flow of Income and Spending: Economics.” tutor2u, 2 Mar. 2021, www.tutor2u.net/economics/reference/circular-flow-of-income-and-spending.

Comments